
A multiple gene list feature enrichment analyzer for the dissection of biological systems
ToppCluster is a tool for performing multi-cluster gene functional enrichment analyses on large scale data (microarray experiments with many time-points, cell-types, tissue-types, etc.). ToppCluster facilitates co-analysis of multiple gene lists and yields as output a rich functional map showing the shared and list-specific functional features. The output can be visualized in tabular, heatmap or network formats using built-in options as well as third-party software. ToppCluster uses the hypergeometric test to obtain functional enrichment achieved via the gene list enrichment analysis option available in ToppGene (Chen, Xu et al. 2007).
ToppCluster input can be one of two types:
Various parameters can be selected for the tests like P-value cutoff and multiple testing correction methods. One or more annotation sources can be included in the results, with a choice of 17 different annotation types. Results can also be filtered by minimum and maximum genes present in annotations. Results can be obtained in tabular formats as comma-separated values, tab-separated values, HTML table or Microsoft Excel format. It is also possible to get the results in three visualization formats – a standard heatmap in a PDF file generate using R (R-Development-Core-Team 2007), TreeView (Eisen, Spellman et al. 1998 and Saldanha 2004) heatmap format files or Cytoscape (Shannon, Markiel et al. 2003) importable network formats.
The ToppCluster interface is user-friendly and provides easy options to perform a comparative enrichment analysis. View the sections and their associated numbers to learn more about the ToppCluster interface.
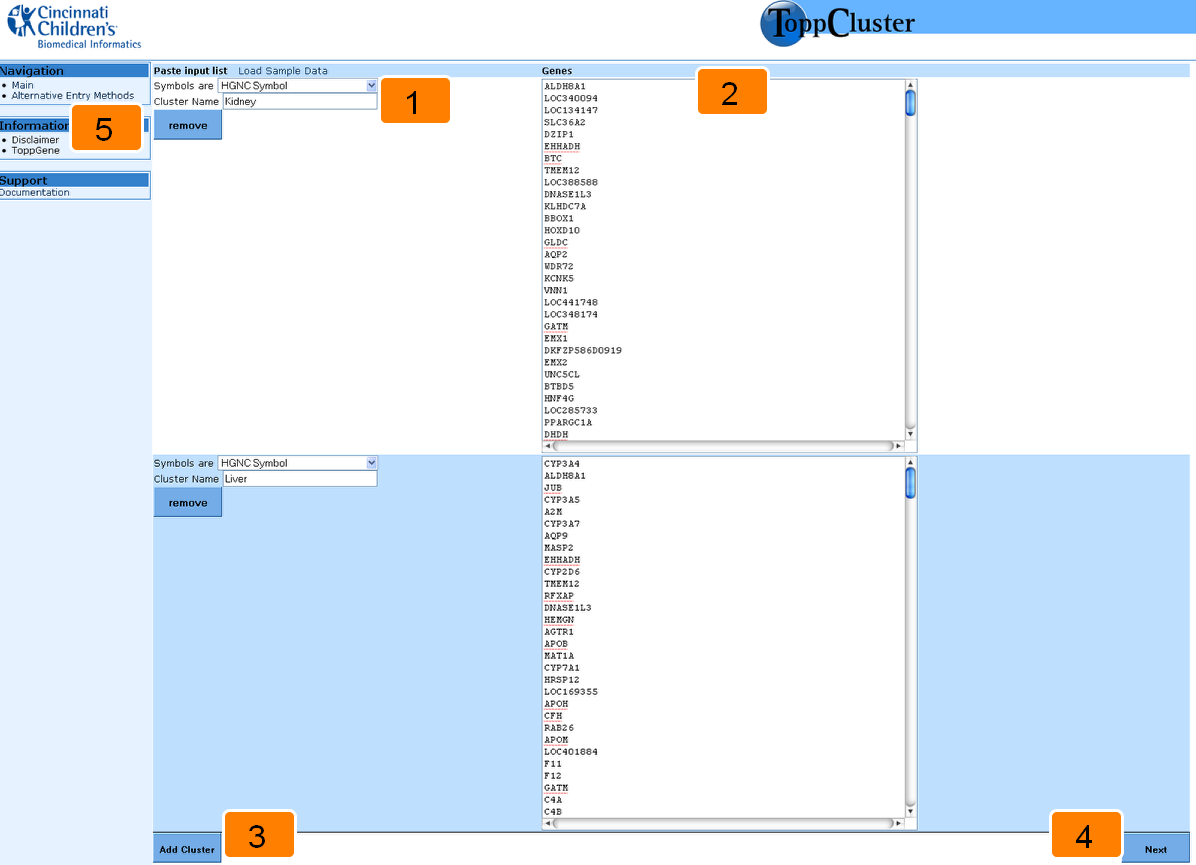
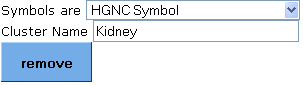
1. Select the gene identifier and choose a cluster label.
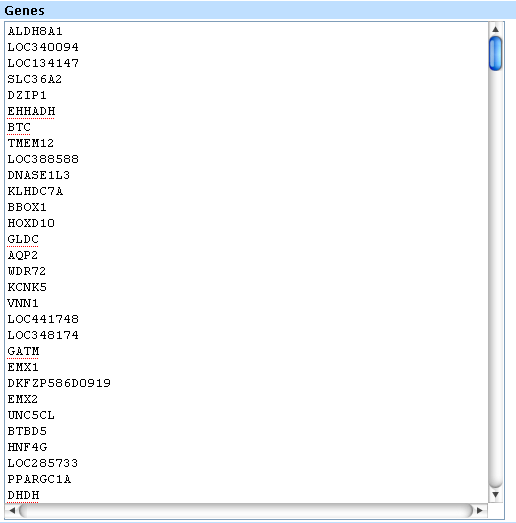
2. Enter your gene cluster.
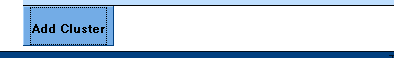
3. Add another cluster.
4. Submit the gene clusters.
5. Alternate input method.
1. Select what gene identifier is being used. Your choices include:
2. Paste your gene cluster list in the input list box.
3. If you need to add more gene clusters, click on the add cluster button.
4. Click next to submit the input gene clusters and proceed to the next stage.

5. Alternate entry method in the form of a two column list, with genes in the first column and gene cluster labels in the second column.Columns can be separated by tab, comma, semi-colon or vertical bar.
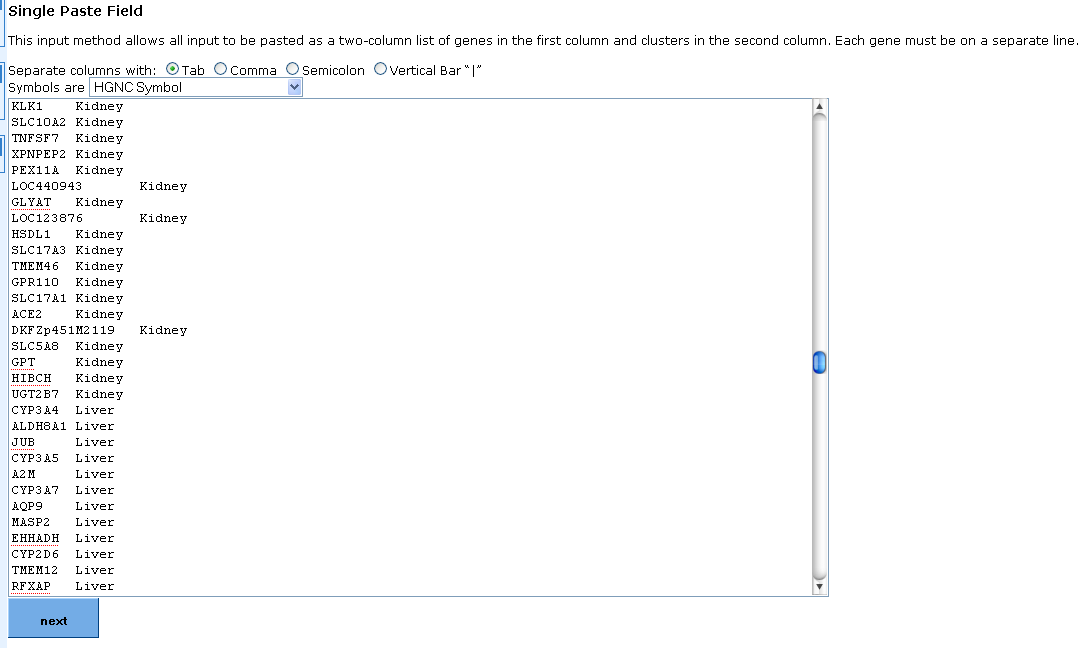
Clicking the "Next" button on either input method takes you to the paramaters selection screen.
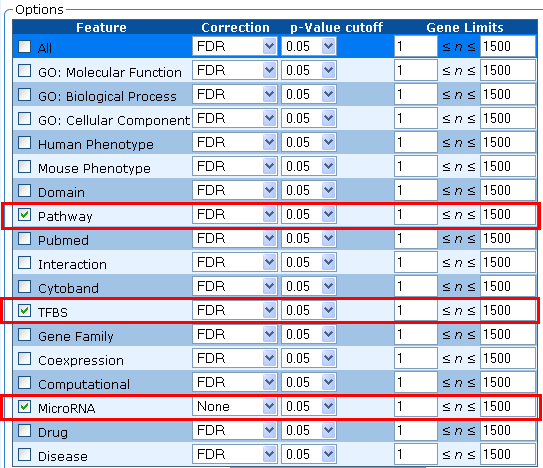
6. Select the annotations and cutoffs.
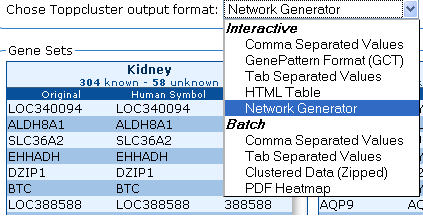
7. Choose the desired output format.
8. Submit for analysis.
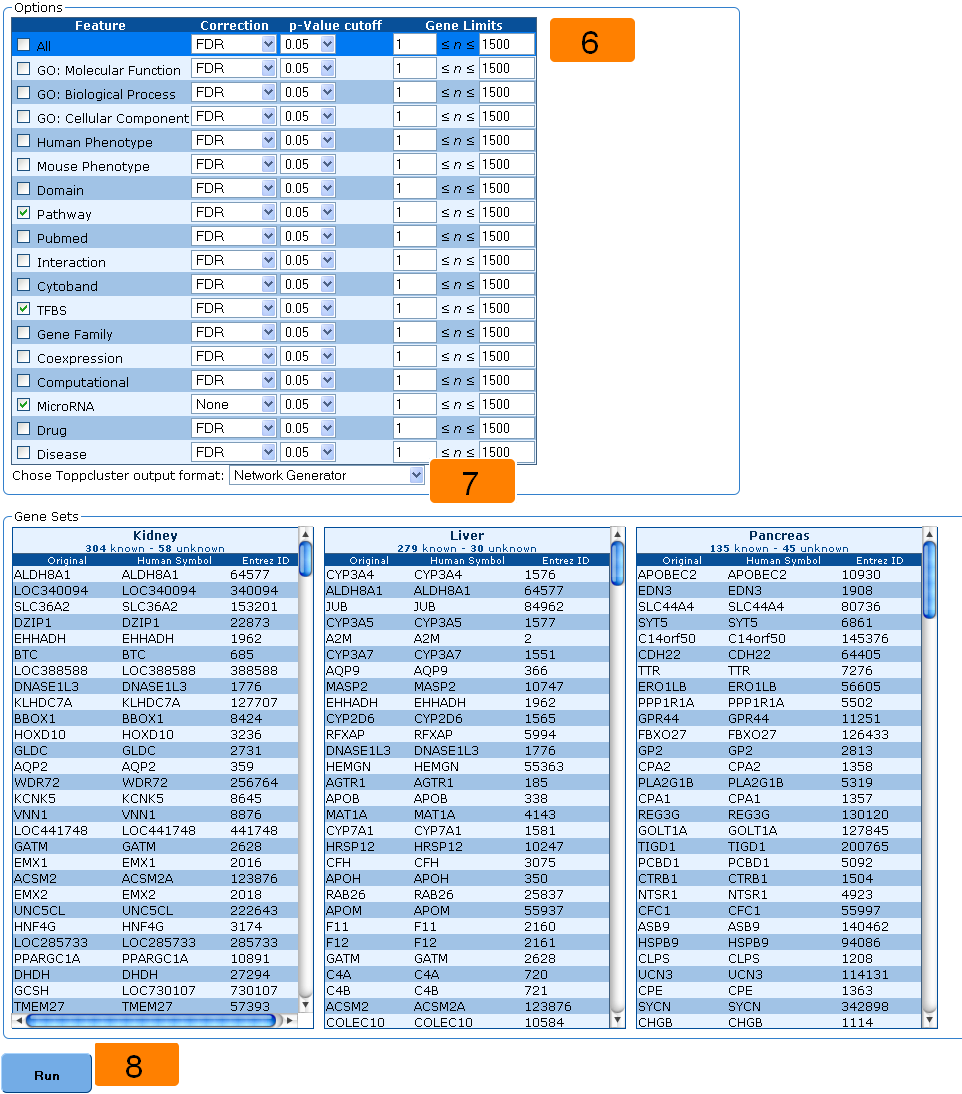
6. By default, all annotations are selected. Select annotations you want to be included in the output and the correction method, p-value cutoff and gene limits (minimum and maximum number of genes allowed for an annotation) you want to use for each annotation. Your choices of correction methods include:
7. There are two types of output formatting available: Interactive
and Batch. In interactive formatting, results will be displayed on the
screen or be available for immediate download once the system has processed your input. Batch formatting will
send results to an email of your choice and includes options not
available in the standard Interactive format.
You will receive an email from bmi@cchmc.org.
Select the formatting you want to use for output.
8. Click Run.
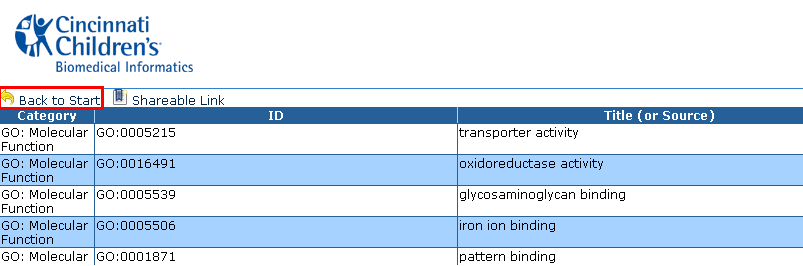
The HTML Table Output Results show a table of multiple columns and rows such as Category, ID, Title (or Source), Verbose ID, and many other columns.
Back to Start
Each of the interactive HTML output pages contains a âBack to Startâ
to return to your original ToppCluster screen.
Click on the "Back to Start" link to return to your original ToppCluster screen.
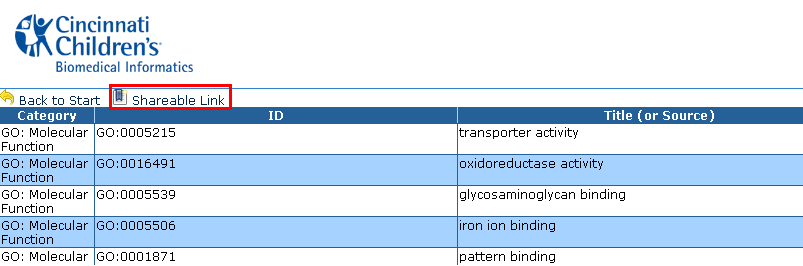
Shareable Link
Each of the interactive HTML output pages contains a ‘shareable
link’ or a ‘long term link’ to retrieve output directly at a later
time or to share the output with a collaborator. The results associated
with a link are stored for 30 days from the time of generation.
Click on "Shareable Link" to create a stored session. Then highlight and copy the link to share.
The initial Network Generator Output screen shows a table of multiple columns and rows such as Category, ID, Title (or Source), Verbose ID, and many other columns.
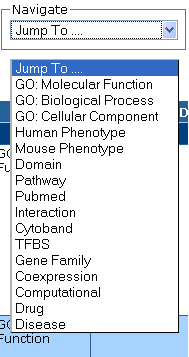
Navigate
The Navigation drop-down menu displays all the available annotation types in your
Extended HTML Table. Select the annotation type you want to jump to and let the
system automatically relocate your position to the category you
selected.
Links
The Links section provides two options:

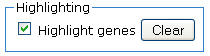
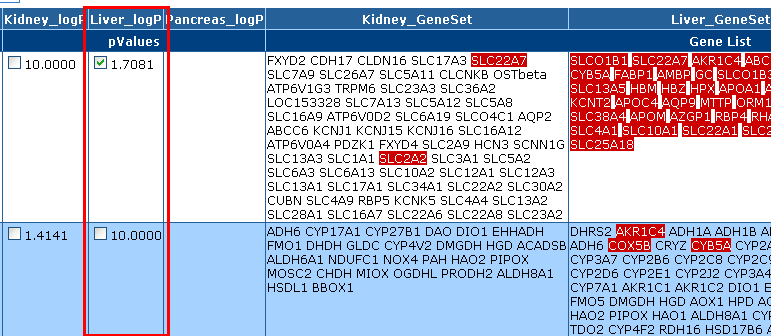
Highlighting
The Highlighting section provides an option to highlight genes in the
"Gene Set" column. If a p-value is checked, all genes
associated with that p-value are highlighted on the entire results page.
To highlight genes, click on the "Highlight genes" check box.
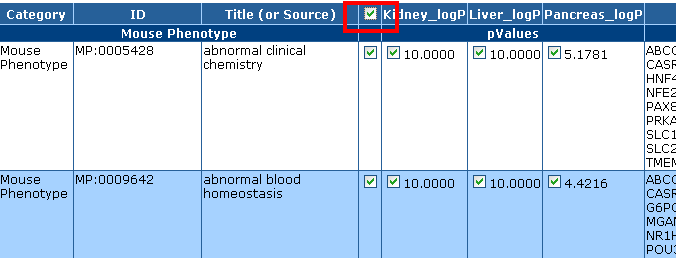
Select All
The checkbox in the header row next to the "Title (or Source)" column allows you to select all the checkboxes on the page.
Network Generator
After selecting all or some of the results the you desire to be included in the network output, click on "Next"

Network Generator Page
The Network Generator page allows you to select properties like the type of network, the layout algorithm and the file format.
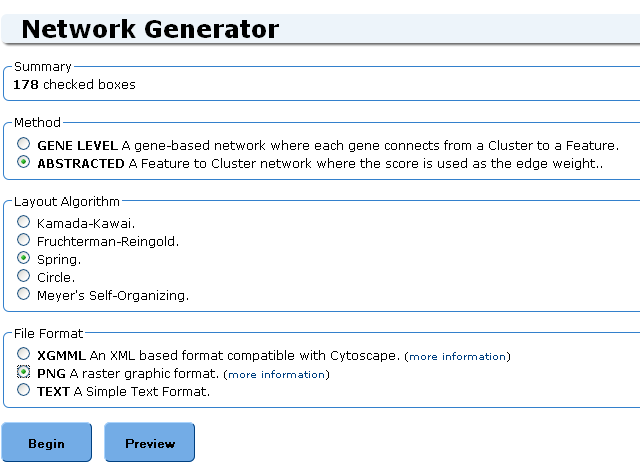
Summary
Summary shows a count of the number of boxes you've checked in the previous screen. It is possible to go back in your browser and select more boxes.
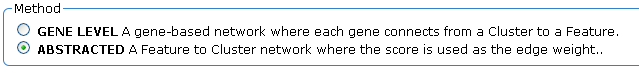
Method
Two types of networks can be generated:
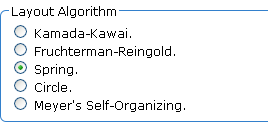
Layout
Five layout options are available:
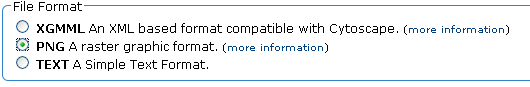
File format
Three formats are available:
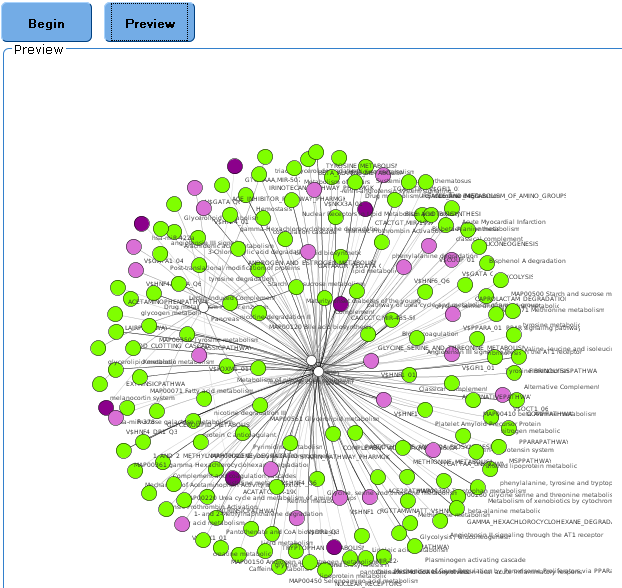
Preview
Preview shows a smaller version of the PNG format in the "Preview" window below.
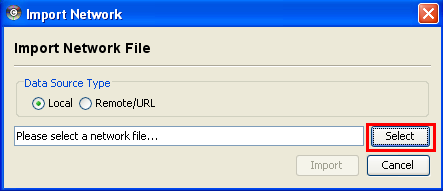
Using XGMML in Cytoscape
An example XGMML file can be downloaded here.
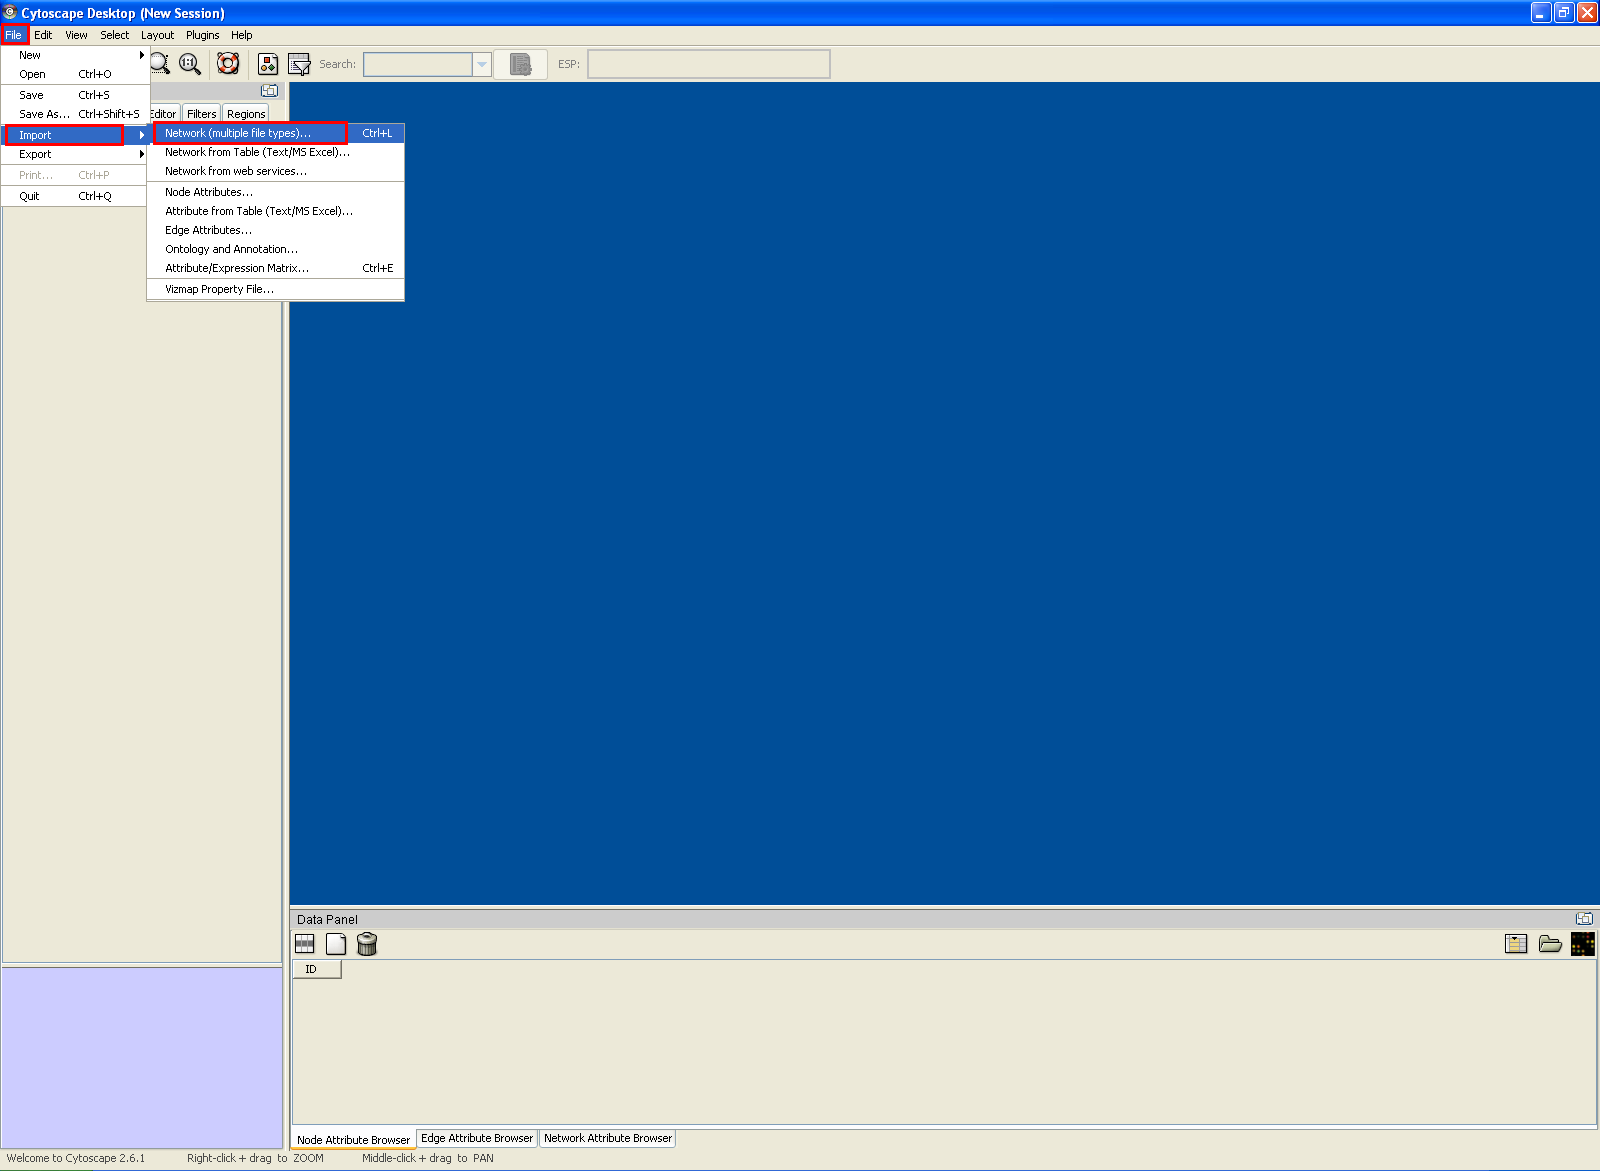
In the "Import Network" dialog, choose "Select".
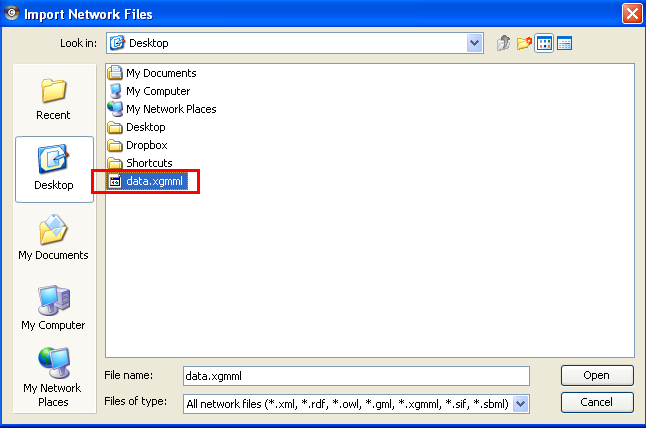
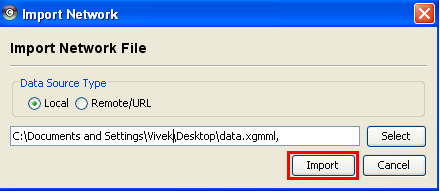
In the "Import Network Files" dialog, locate and choose the XGMML file and back in the "Import Network" dialog, choose "Import".
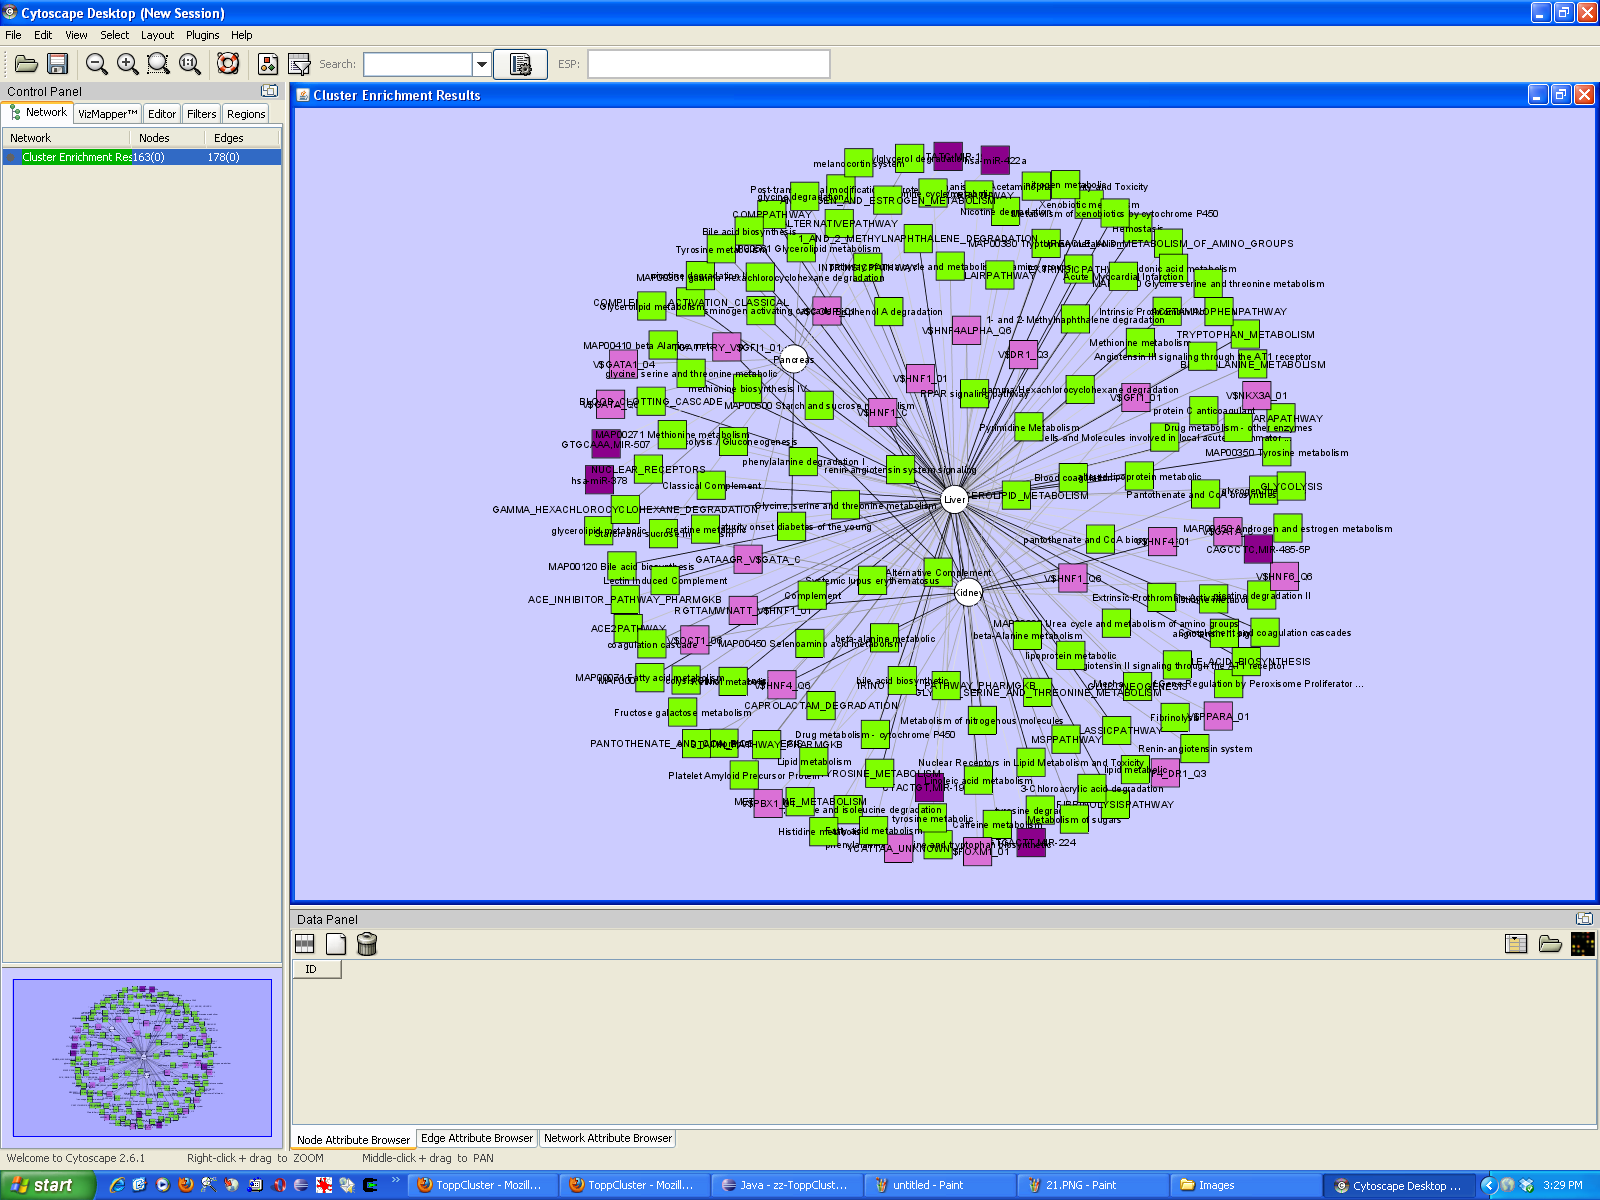
The network can be viewed and analyzed further in Cytoscape.
TreeView format CDT files can be obtained by choosing the "Clustered Data (zipped)" option from the ToppCluster output formats. An email address needs to be provided; the results are emailed to this address.

Once computed and generated, a ZIP file containing the CDT file set is emailed to the email address provided. Additionally, an online Java TreeView link to the results is provided. This link is made available for 21 days.

An example CDT file set can be downloaded here.
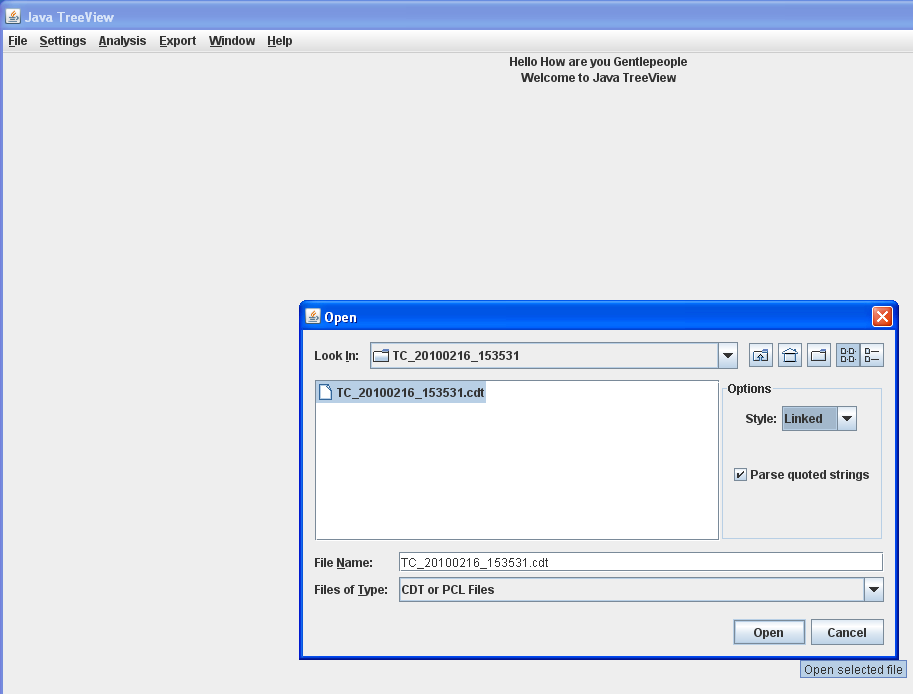
Unzip the CDT files to a convenient location.

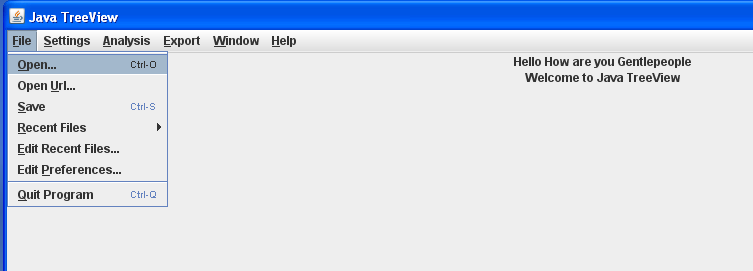
In the "Open" dialog, locate the unzipped Clustered Data files, select the CDT file, and click "Open".
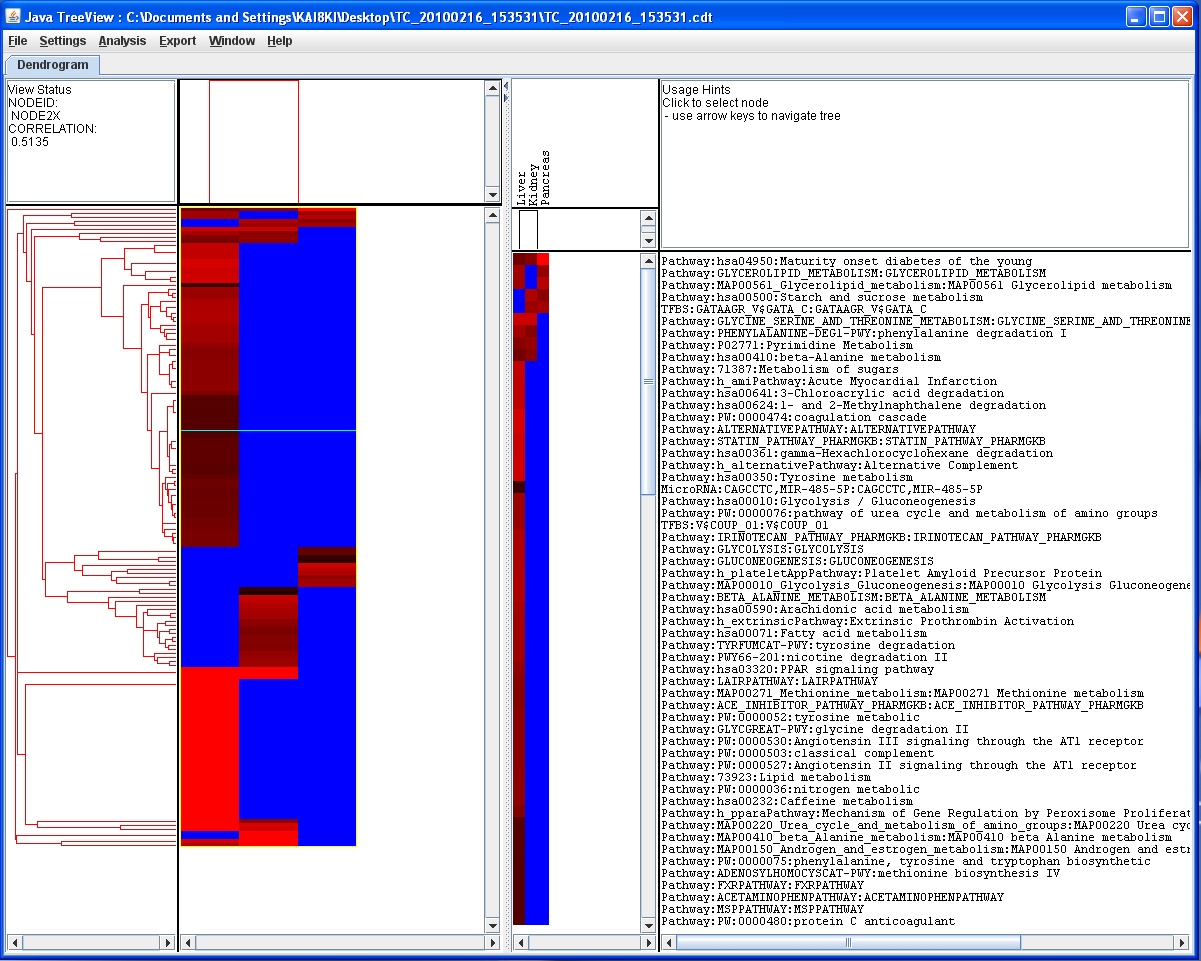
The clustered data tree can be viewed and analyzed further in TreeView.
Chen, J., H. Xu, et al. (2007). "Improved human disease
candidate gene prioritization using mouse phenotype." BMC
Bioinformatics 8: 392.
Eisen, M. B., P. T. Spellman, et al. (1998). "Cluster analysis and
display of genome-wide expression patterns." Proc Natl Acad
Sci U S A 95(25): 14863-8.
Alok J. Saldanha. (2004). "Java Treeview—extensible visualization of microarray data."
Bioinformatics 20(17):3246-3248.
R-Development-Core-Team (2007). "R: A language and environment for
statistical computing." R Foundation for Statistical
Computing, Vienna, Austria. ISBN 3-900051-07-0, URL http://www.R-project.org.
Shannon, P., A. Markiel, et al. (2003). "Cytoscape: a software
environment for integrated models of biomolecular interaction
networks." Genome Res 13(11): 2498-504.